In 1989, Indiana Jones and the Last Crusade taught me one of the most important lessons in investing.
It was the first film to break $10m in sales in a single day. $50m in 7 days (also a new record). $100m in 19 days (also a record).
And at $474m in sales, it was the highest grossing film of the year (and at the time, the 11th highest grossing of all time).
What was the lesson I learned from this George Lucas hit?
X Marks The Spot
For those of you who don’t remember the movie…
In one of the early scenes, Indiana Jones – played by Harrison Ford – is now teaching in some university somewhere. In front of his classroom of students, he says…
“Archeology is the search for fact, not truth. If it’s truth you’re interested in, Dr. Tyree’s philosophy class is right down the hall.
So forget any ideas you have about lost cities, exotic travel, and digging up the world.
We do not follow treasure maps to buried treasure, and X never, ever, marks the spot.”
But the adventure begins when he receives a diary in the mail written by his father, Henry Jones, Sr. – played by Sean Connery.
From there, he winds up in a library where Henry was last seen, and in a well scripted bit of irony…
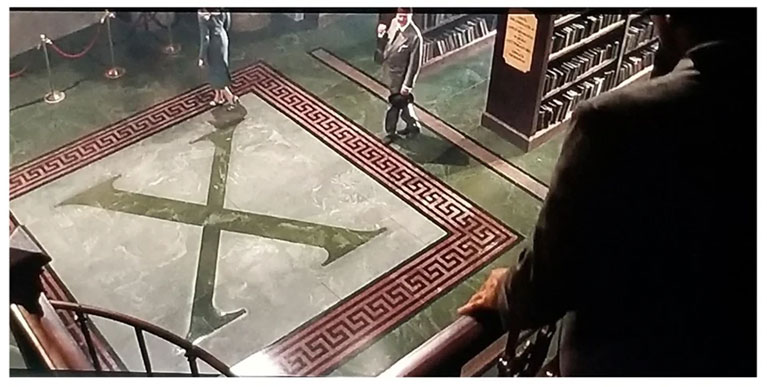
X does, in fact, mark the spot!
“X marks the spot.” Image from the movie Indiana Jones and the Last Crusade
And even though we might think treasure maps that lead to buried treasure where X marks the spot are silly plot devices reserved for fiction…
Those are the facts when it comes to mining and exploration!
Here’s what I mean…
In many ways, junior mining companies are essentially the modern day “Indiana Jones” in search of buried treasure.
However, the “treasure maps” modern day explorers use are far more sophisticated than what you’ve seen in movies.
Generally speaking, mineral rights are owned by the government, whereas the surface rights may be owned by individuals, groups, corporations or government.
That’s why explorers need to acquire permits (and pay taxes/fees) from the host government before they can start operations.
But how do they figure out which areas are worth exploring?
It turns out, governments have entire departments dedicated to helping explorers answer that question.
For example, The United States Geological Survey was created by Congress in 1879 for “classification of the public lands, and examination of the geological structure, mineral resources, and products of the national domain”
Today, their Mineral Resources Program publishes numerous mineral-related maps, including maps for mineral resource assessments, geologic map data, soil geochemical maps and hyperspectral surface materials maps.
In addition to technical maps, Story Maps are used to engage the public in the interesting science that is being conducted in the Program.
Or put another way, the government funds research in an effort to promote mining activity (which, in turn, hopefully generates taxable economic activity).
According to Robert Stevens in his 2011 book Mineral Exploration and Mining Essentials…
Some studies suggest that within a few years of being released, more than $5 dollars in new exploration spend-ing is undertaken for every $1 dollar spent by the government on new high quality exploration data.
And as more investment capital comes into the area, the more detailed the “treasure maps” become.
If the explorers know what work has been done, where it was done, and the results of that work, it can help guide the company to the most promising regions and properties.
Strangely enough, in many cases, this data can reveal high-quality targets that – for whatever reason – were never properly explored.
According to Craig Auringer, founder of Bonsai Capital: “This happens quite often in this industry. Properties are overlooked for decades, centuries, then wind up being the most profitable assets on a company’s books”
This is exactly what might have happened with Durango Gold’s Claudia Project (and why CEO Fernando Berdegué is so excited by the property).
If you haven’t had a chance to read up on the project, here’s the short version.
The plot of land has changed hands a number of times.
Why? Because the previous operators were small companies focused on cash flow from immediate production, which means focusing on existing, working mines… not exploring for new deposits!
However they left behind their possible “treasure map” – which, to be clear, refers to their previous geologic assessment maps – for the Durango Team to base their exploration efforts on.
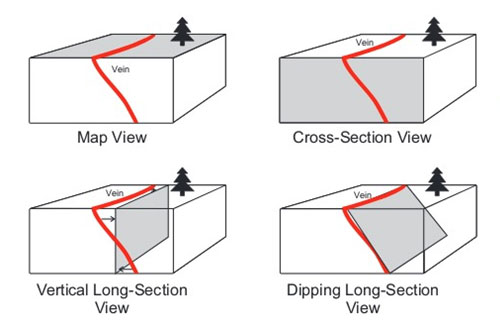
To be a whole lot more specific, there are three types of maps that are used to present exploration data: map view, cross section view, and long-section view.
Map View is a top down view that most people are familiar with thanks to highway and city maps.
However, they might see an exploration map and have no idea what’s going on.
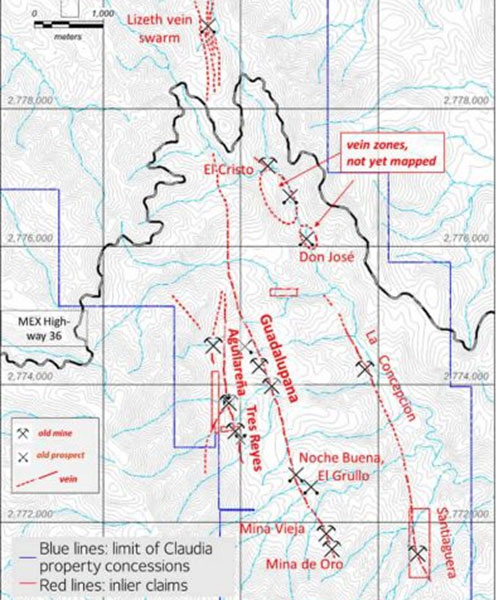
Here’s the map of the Claudia Project as an example.
Map View of the Claudia Project
This is what’s called a topographic map, which is designed to represent the forms and features of land surfaces.
The gray squiggly lines represent elevation (the closer together, the steeper the elevation change).
Those sky blue lines are water sources.
The dark blue lines represent what’s called the property concession (or where they have rights to explore).
But what starts to make this map more useful is the dotted red lines – which represent where the explorers think the minerals are in the ground – and the X’s – which represent where previous mines (or prospecting efforts) already are.
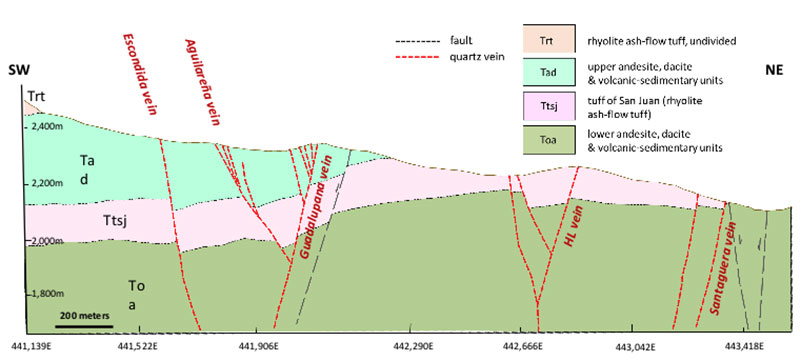
Cross Section View provides a lateral view of the project, designed to show subsurface features (like rock formations and veins).
Usually, these are oriented perpendicular to the direction of the vein.
Cross Section View of the Claudia Project
In this example, imagine you are standing at the north end of the Claudia Project map and you are looking south.
Last but not least…
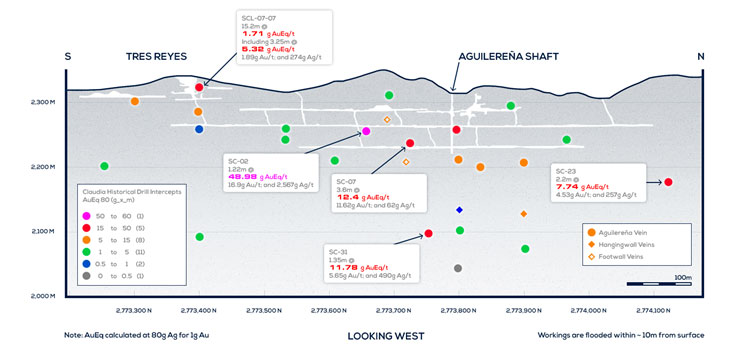
Long Section View is a vertically oriented map that is parallel to the vein.
They are commonly used to show the shape, size and grade distribution of a mineral deposit.
Long Section View of the Claudia Project
In this picture, imagine we are standing right on top of the Tres Reyes and Aguilereña shaft – which is dead center on the map view – looking west.
This map was originally created by the previous owners of the property.
But more interestingly, the previous owners also indicated the presence of several potentially high-grade deposits that hadn’t been fully explored.
Unfortunately, the original source data for these results is missing (and therefore, can’t be used for resource estimates).
One of the goals of Durango’s current drill program is to test and attempt to confirm these results.
…and if they can confirm – or even extend – previous findings, it could be a significant catalyst that would not only help increase shareholder value…
But it could set the stage for Durango Gold’s potential IPO sometime in 2022.
If you’d like to learn more about Durango Gold – and what needs to happen before they start the IPO process – be sure to check out the recent interview we hosted with the CEO, Fernando Berdegue right here.
If you don’t have the full hour and 44 minutes, you can also download a copy of my interview notes to skim through by clicking here.
Sincerely,
Jake Hoffberg – Publisher
Equifund


